Transit Patrol Planner
From reported risk to explainable patrol routes.
A research prototype that combines risk ranking, operational constraints, and fairness checks for NYC subway patrol planning.
- Classification
- Geospatial routing
- Fairness evaluation
- Dashboard prototype
- 2020-2025
- Analysis window
- 0.68
- Holdout ROC-AUC
- 91.7%
- Within-shift route rate
- 6 of 6
- Fairness checks passed
The question
Can a patrol planner prioritize higher-risk stations without hiding its tradeoffs?
The prototype converts reported complaint patterns into station-level risk estimates, then builds routes that fit coverage, distance, and shift constraints.
It is designed as decision support. It does not predict individual behavior, automate enforcement, or replace human operational judgment.
Operational prototype
A route that can be inspected, not just accepted.
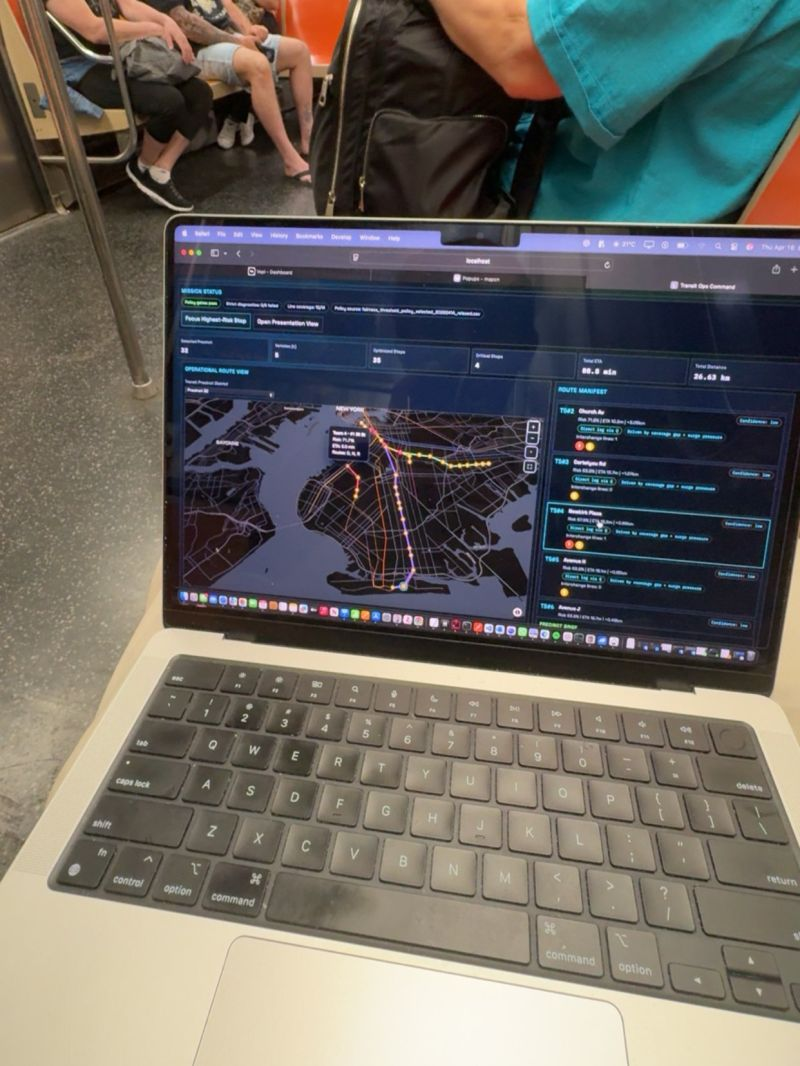
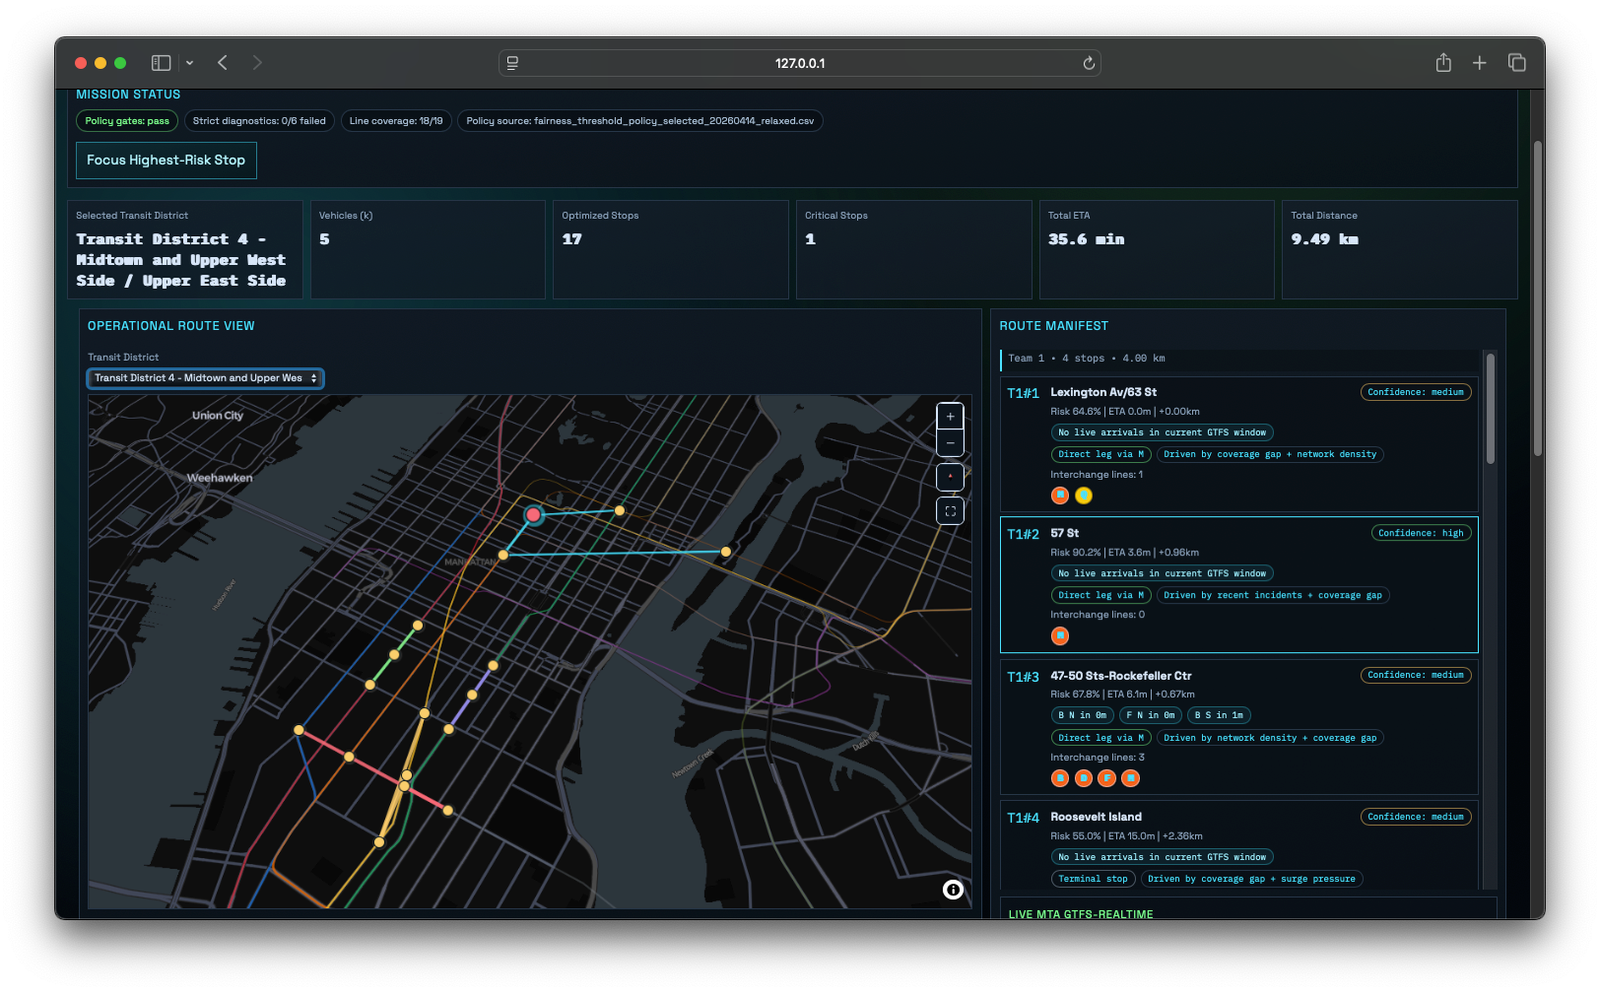
The interface keeps route geometry, stop-level risk, confidence, ETA, line coverage, and the reason for each recommendation visible together.
Evaluation trail
Each design decision is tied to an observable check.
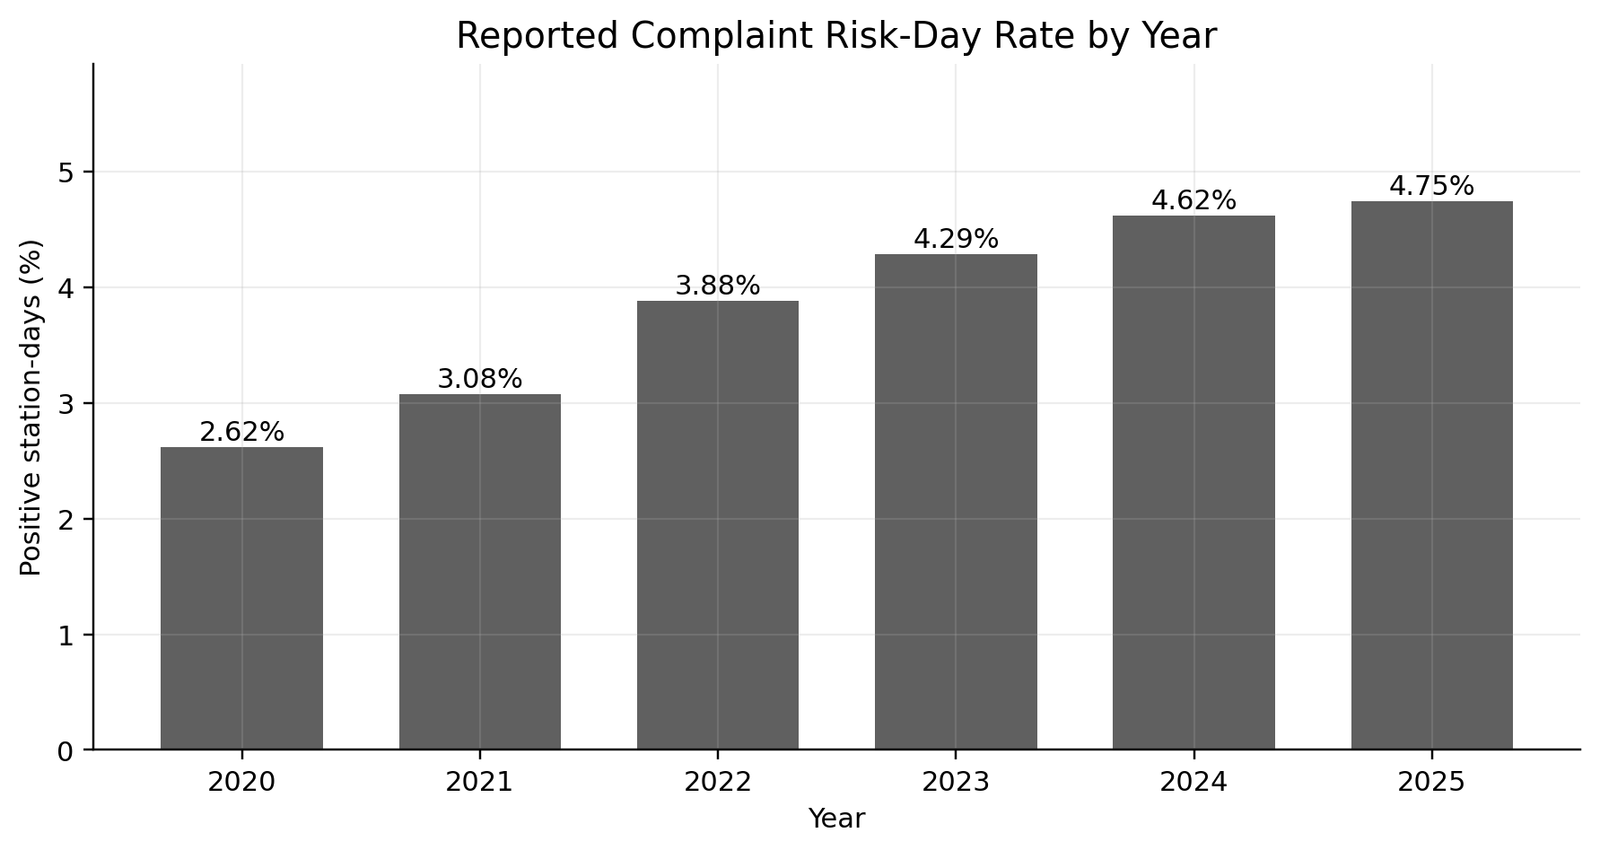
Start with the demand signal
The reported positive station-day rate rises across the analysis window, making temporal holdout evaluation important.
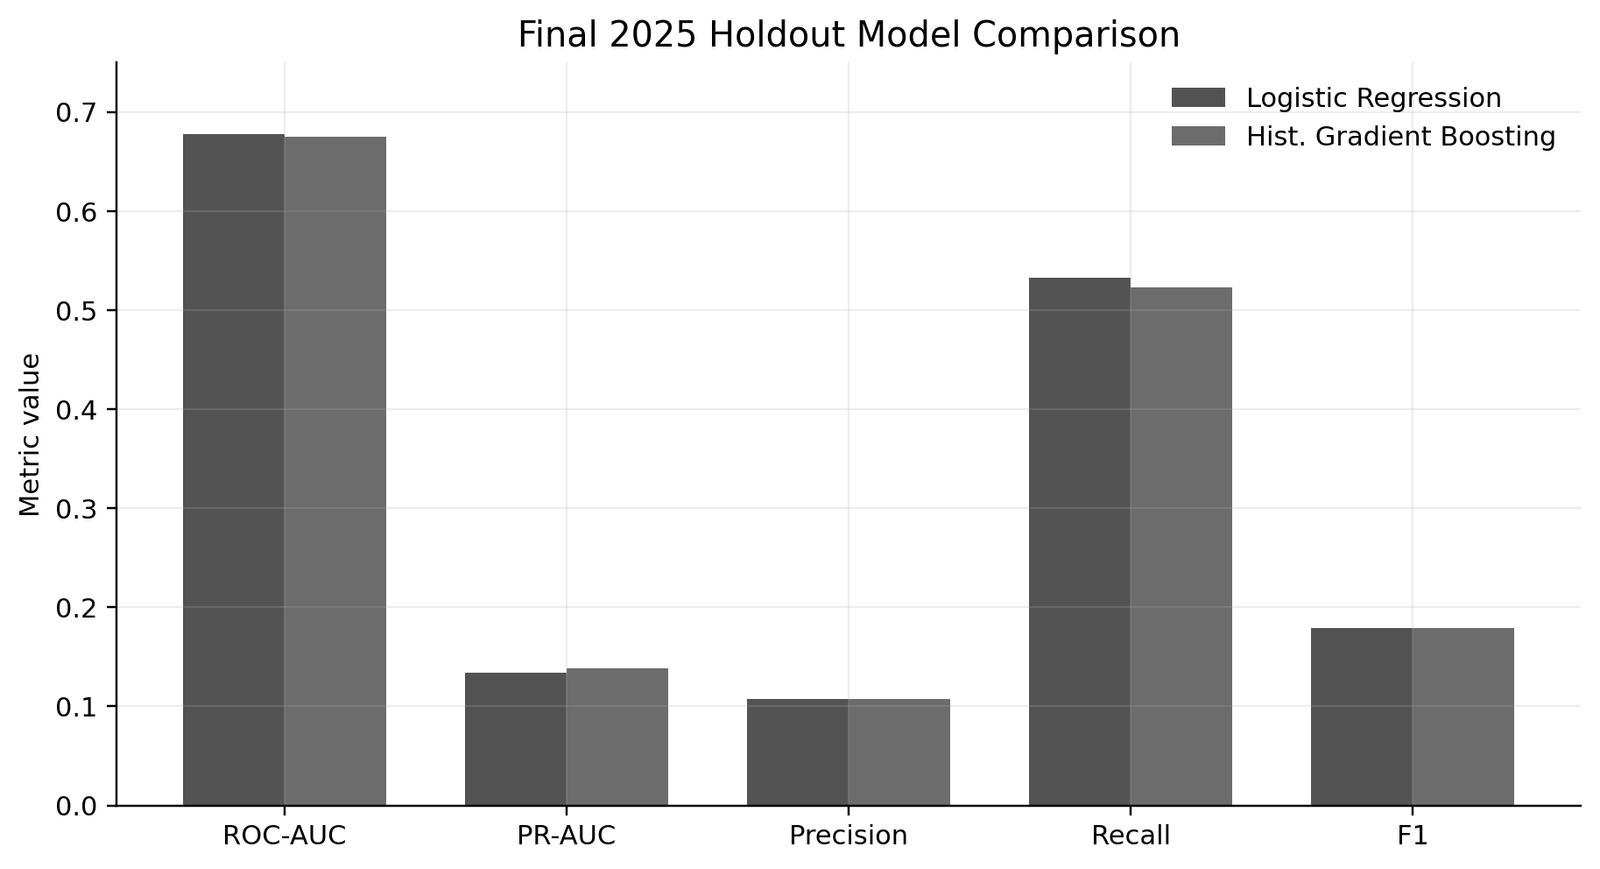
Prefer the simpler model when performance is close
Logistic regression and histogram gradient boosting perform similarly, so interpretability remains a practical selection criterion.
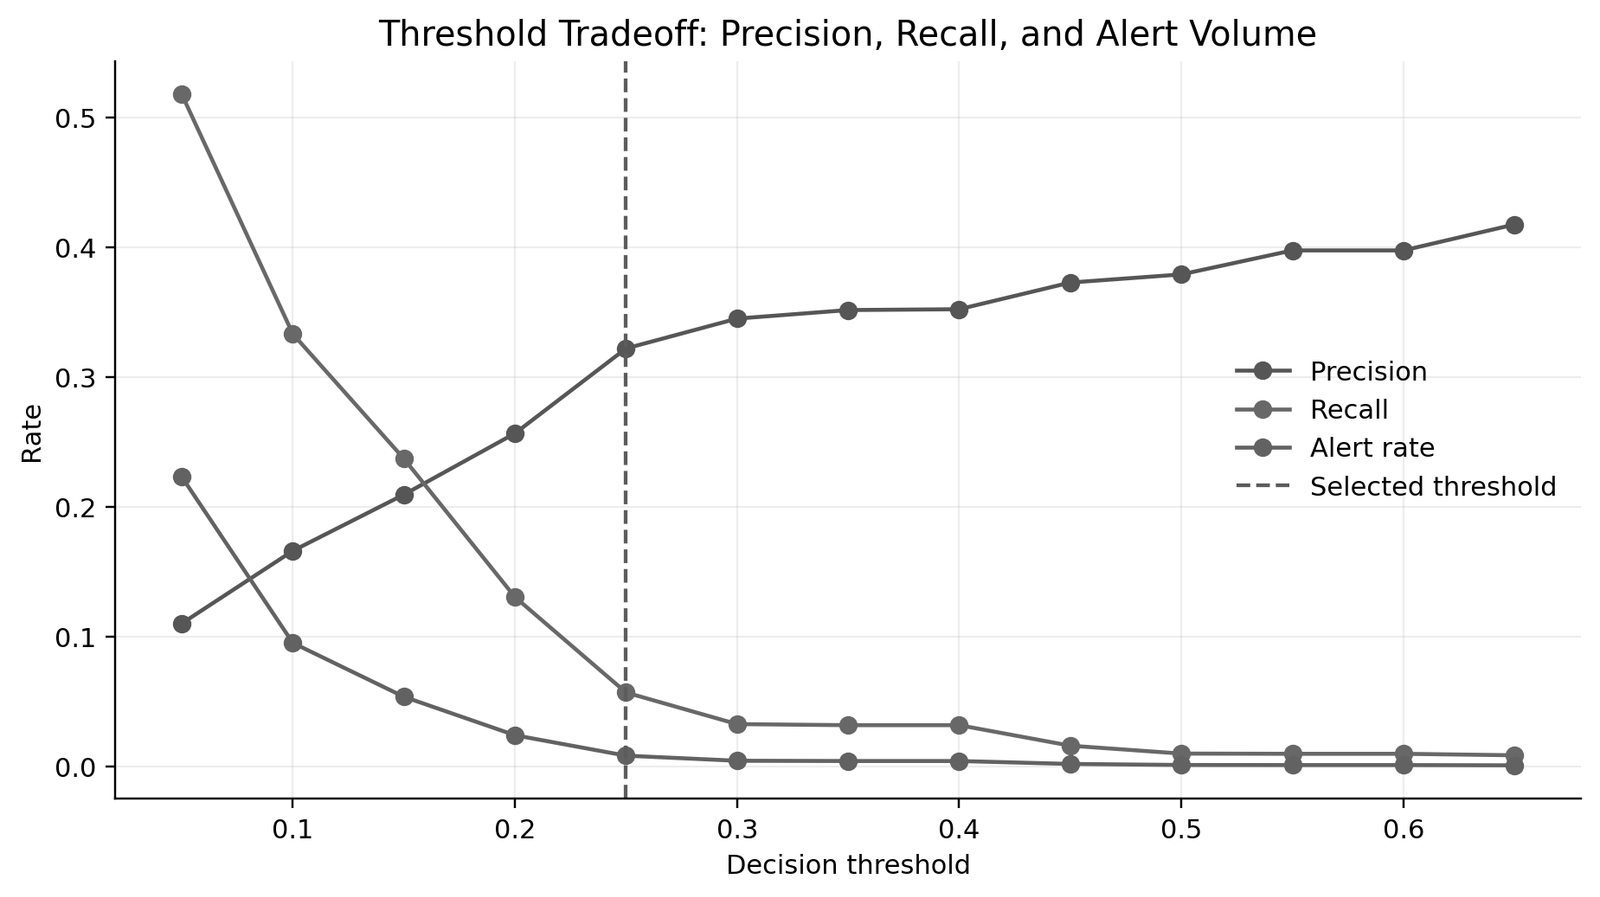
Select an operating point, not just a model
The 0.25 threshold makes the precision, recall, and alert-volume tradeoff explicit before scores enter route planning.
Geospatial layer
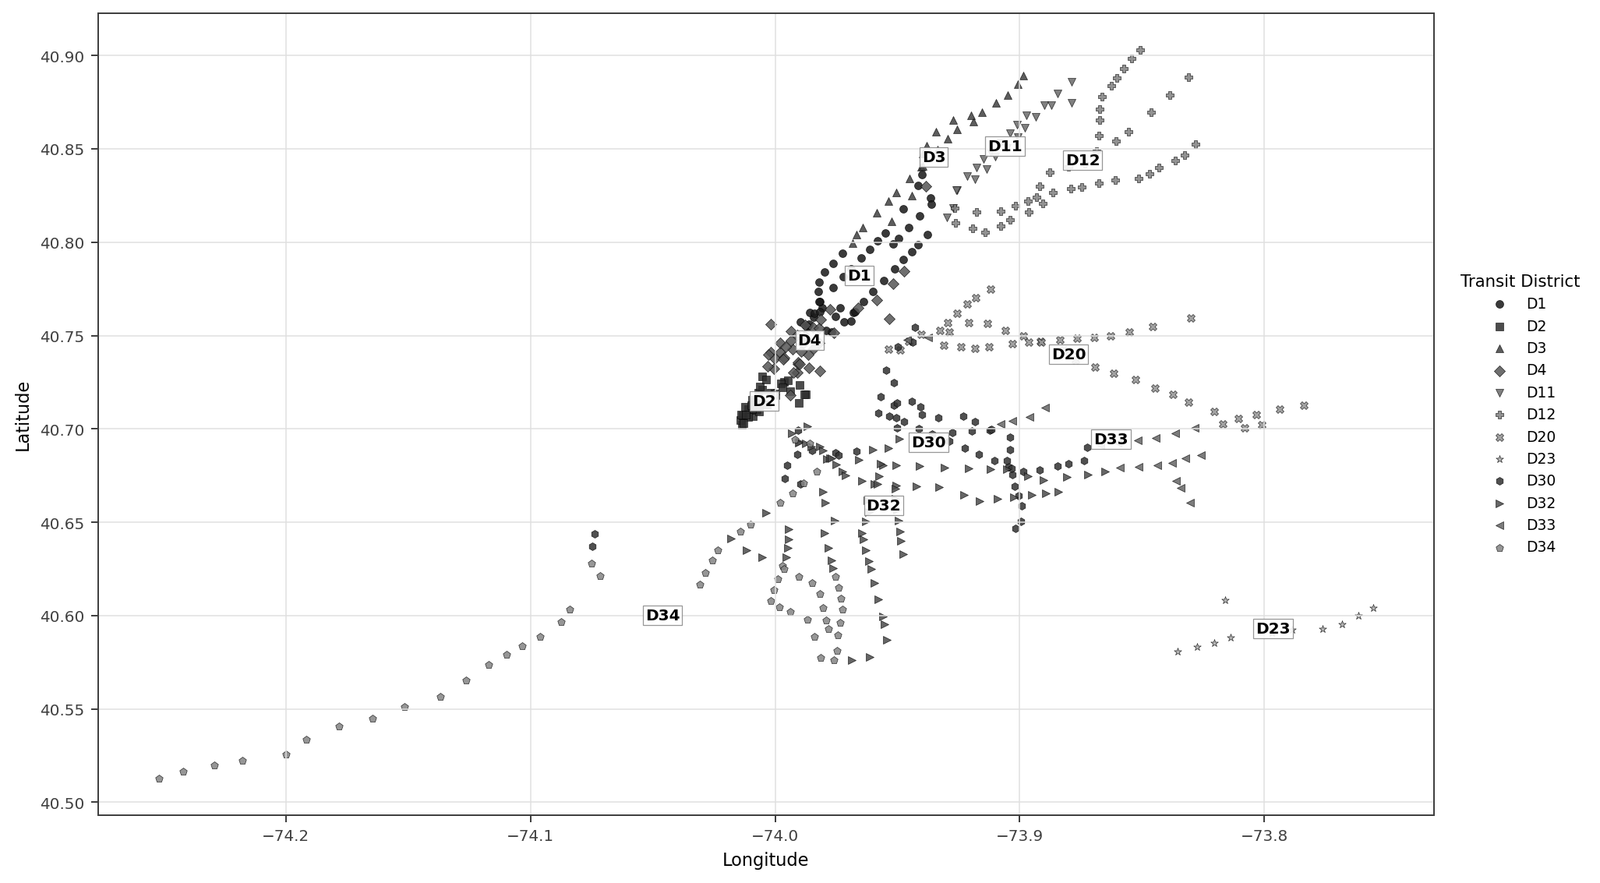
Stations are grouped by operating geography.
The station map associates locations with transit districts before routing. This makes district-level coverage and evaluation possible instead of treating the system as one undifferentiated network.
- Station coordinates
- Transit district membership
- Network and line coverage
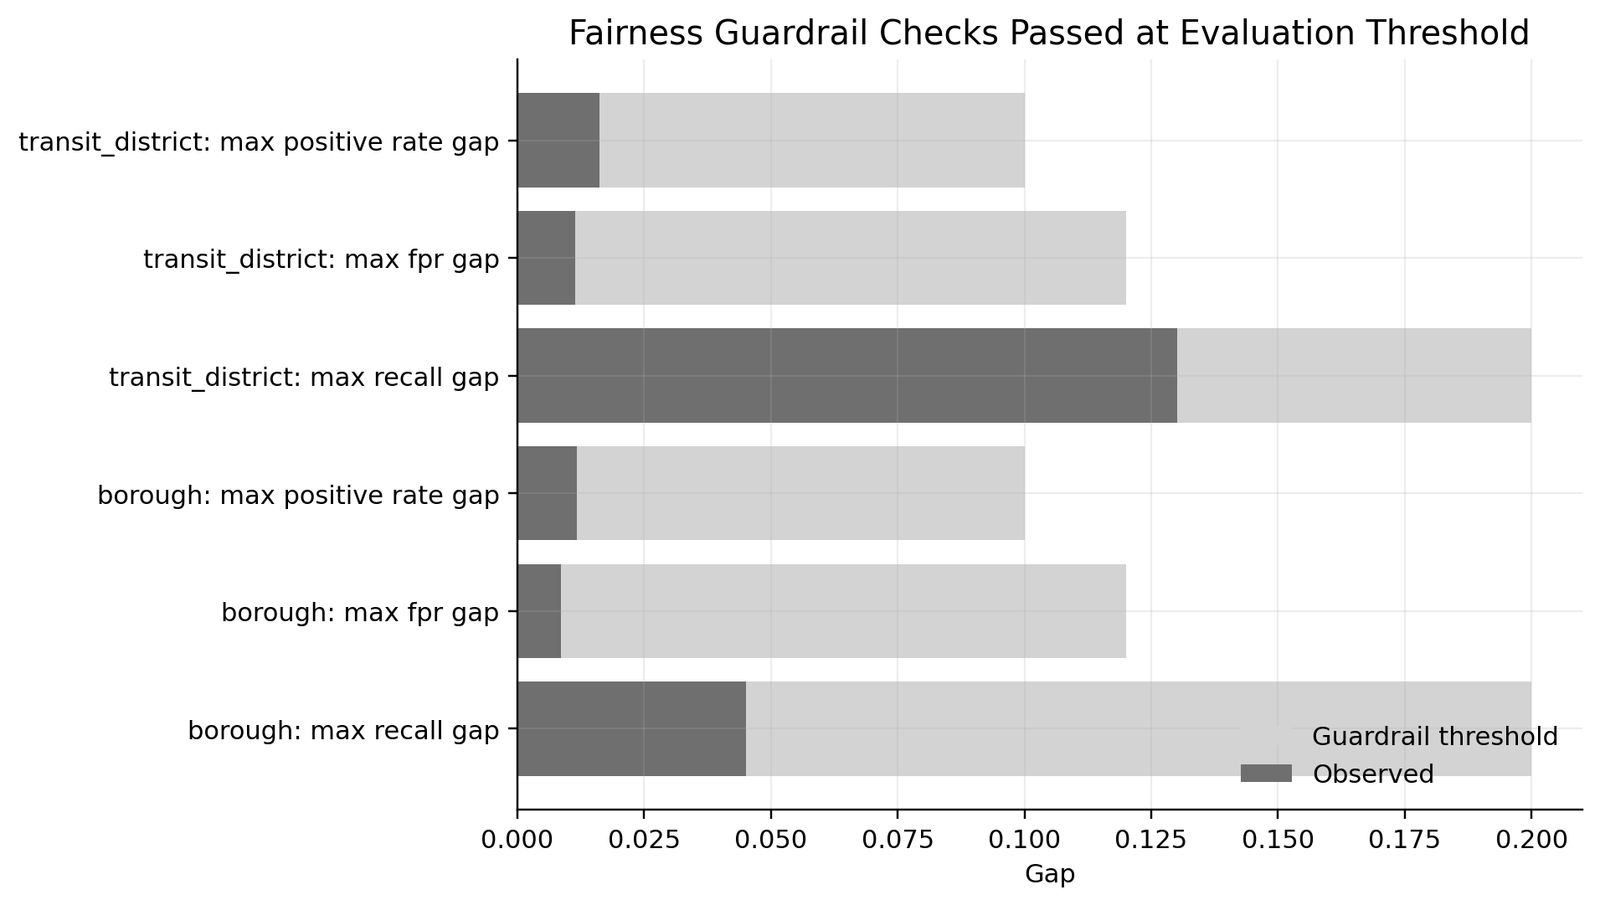
Check group-level gaps
Observed recall, false-positive-rate, and positive-rate gaps remain below the defined borough and district guardrails.
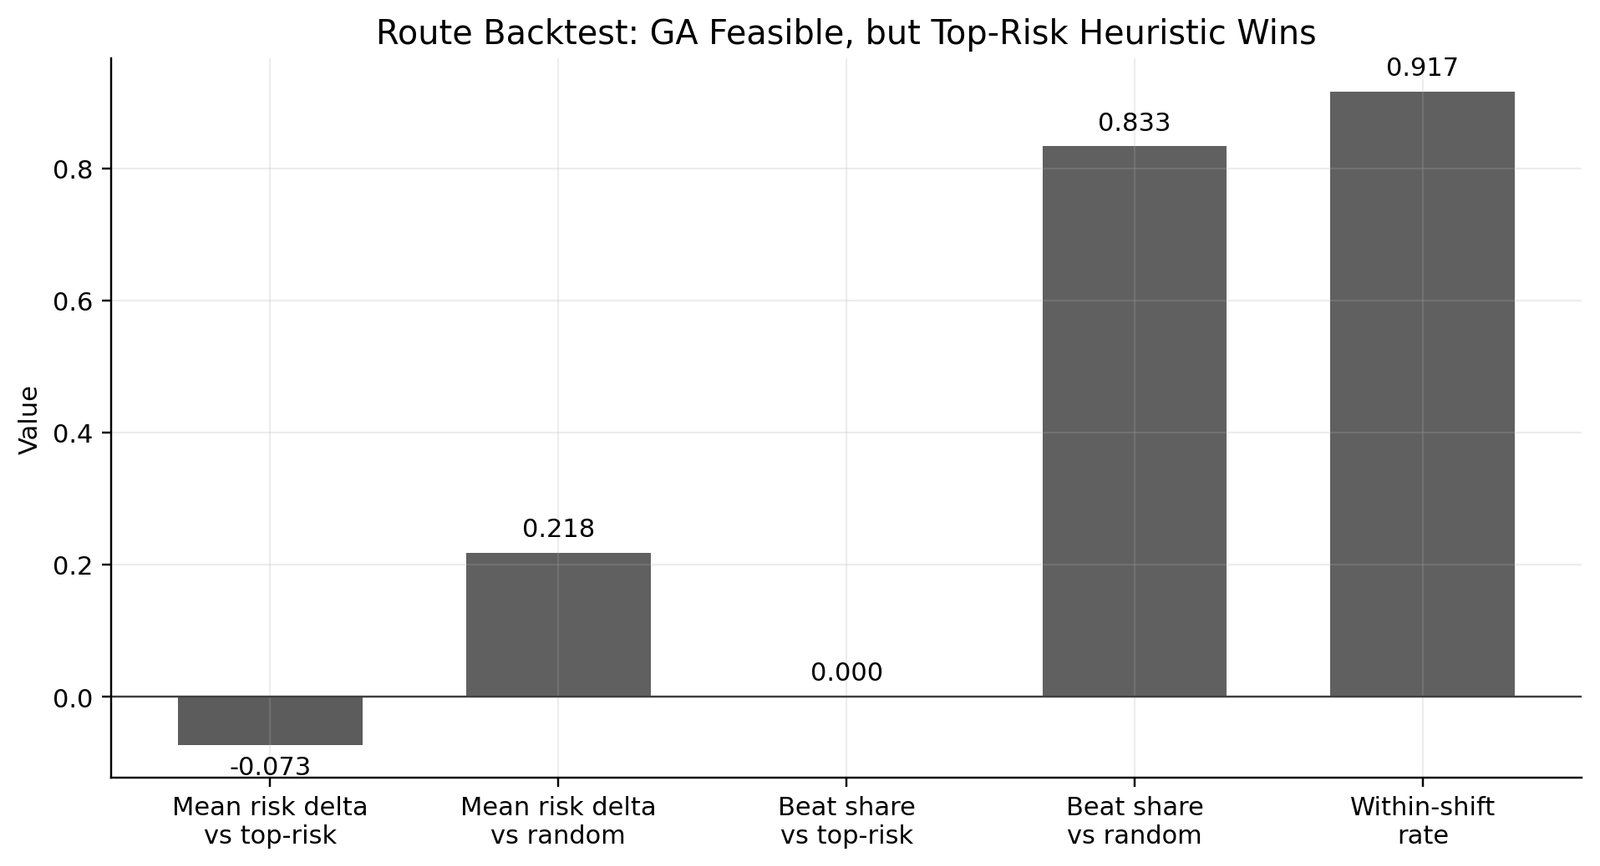
Benchmark the route optimizer honestly
The optimized route is operationally feasible and beats random routing, but the transparent top-risk baseline remains stronger on mean risk.
Scope and readiness
A complete research prototype, not a production system.
The work is strongest as a reproducible analytical artifact and dashboard prototype. Production security, live staffing integration, and outcome validation remain future work.
No automated enforcement or personalized risk decisions.
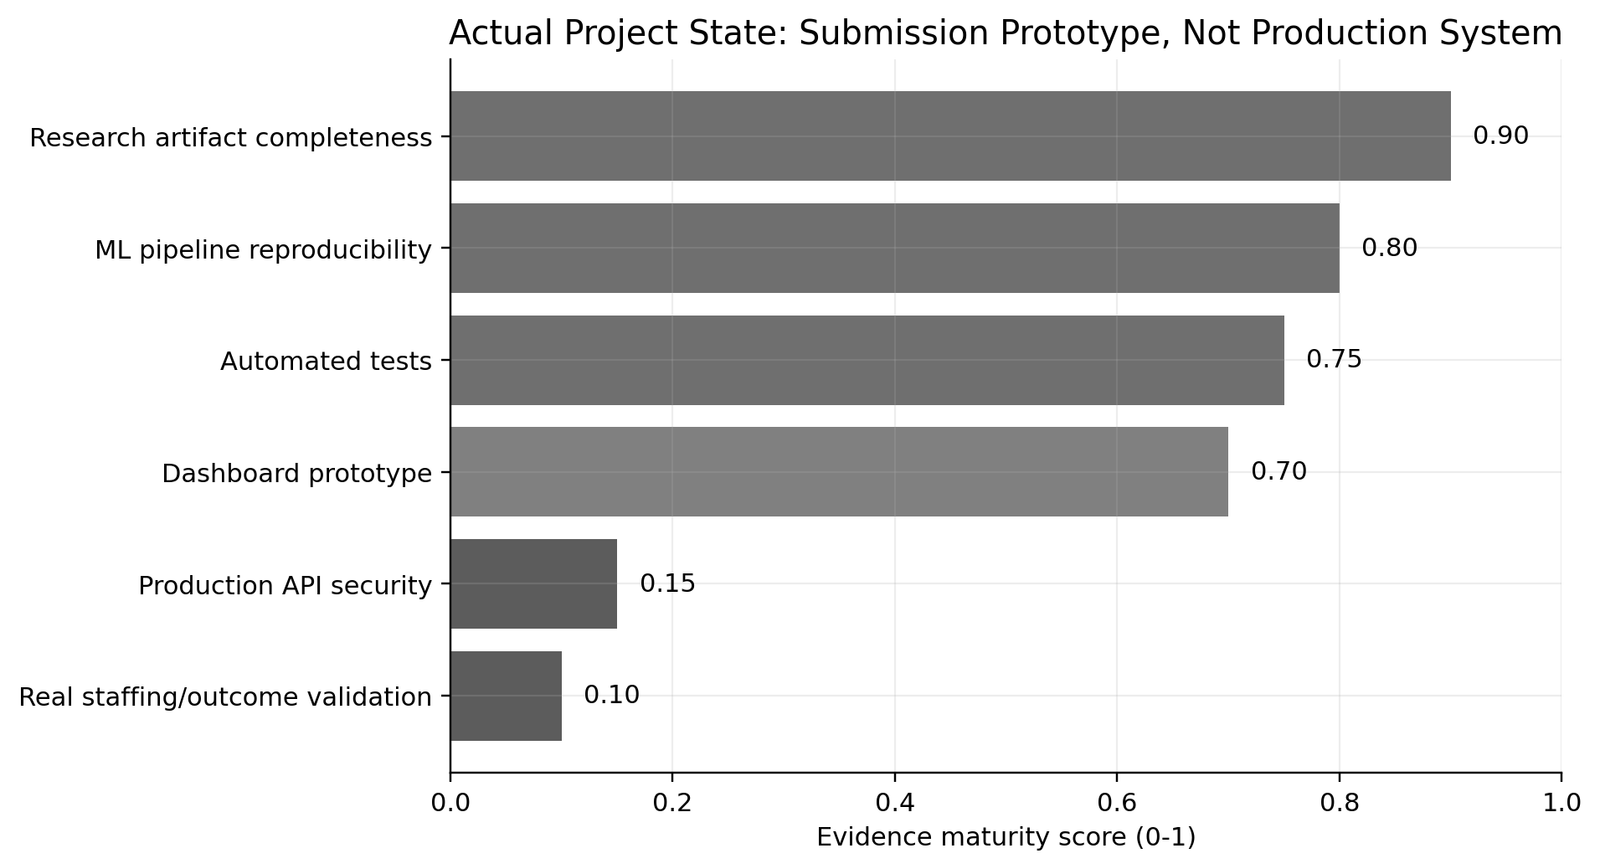
State the boundary clearly
High research maturity does not imply production readiness.
Continue exploring